S.T.E.A.M. at Home: Fun with Food Part II – Sweet Stats
In these times of learning at a distance, many S.T.E.A.M. teachers were caught off-guard. Not having uniform kits made up for all of our students made conducting a virtual S.T.E.A.M. course quite challenging. In this series, we have been offering lesson ideas for the S.T.E.A.M. teacher that can be completed with students virtually, using items that can be found at home or acquired for a minimal cost. This is also an opportunity for children to get their parents involved in the learning process and create a little awareness of your S.T.E.A.M. program.
Our previous project focused on a dual activity that examined triangles with the first triangle inequality theorem and the Pythagorean Theorem. Here, we will examine another branch of mathematics – statistics. We will learn how to examine data, calculate percentages, make predictions, as well as examine permutations and the fundamental counting principle. This is a another great activity that your students are sure to enjoy as it involves two tasty snacks.
Lesson Name: Fun with Food Part II: Sweet Statistics (Candy Count)
Lesson Description: This lesson will have your students take the role of quality control agents whose job it will be to evaluate the candy company’s claims.
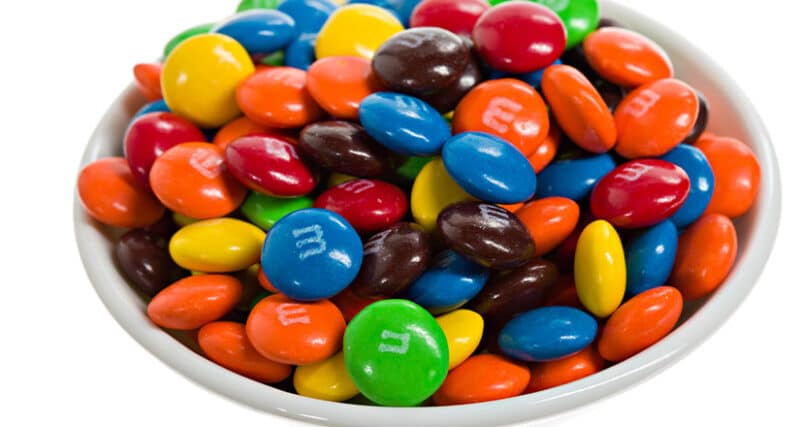
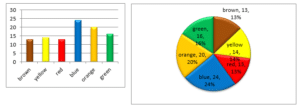
Overview: Students will receive some background knowledge of the M&M’s company history including how the candies are manufactured and the quantities of each color produced. Tell them that they are going to take the role of quality control personnel as they are going to check on the company’s claim as to what percentages of each color are produced. Students will sort the candies and record the quantity of each color in a spreadsheet, which will then be converted into a bar graph and pie chart. Students will then compare their findings to the claims of the company.
S.T.E.A.M. Integration
Science: The science behind this lesson involves researching the history of the M&M. Students will learn that the chocolate got its candy shell to prevent it from melting in warmer weather making it a treat that could be enjoyed all year long.
Technology: The technology is integrated into this project as students can research, through online videos, how the candies are produced.
Engineering: The engineering is involved in how we sort the candies and make our calculations so that we can compare them to the company’s claims.
Art: The art is in the marketing as the students learn how the company studies the trends of each color’s popularity and adjusts the quantities that are produced accordingly.
Math: Mathematics enters this lesson by comparing the company’s claim as to what percentages of each color are produced as they compare to the actual findings in a bag of the candies.
Extend-Expand-Explore: Have students repeat the experiment using random samples of other bags of candy or of bags of different sizes like king size or family size. Students can also compare their results to other members of the class.
Lesson Plan
Title: Fun with Food Part II: Sweet Statistics (Candy Count)
Objective: Students will demonstrate the ability to group, sort, count, compare, and calculate percentages. In addition, they will learn how to create a bar graph and pie chart.
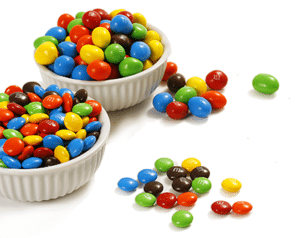
Materials: M&M’s candies (or similar candy that is produced in an array of colors), paper plates, spreadsheet software
Procedure:
- Begin by either providing or assigning students to research the history of the M&M Company. Tell them that they are going to take the role of quality control personnel as they are going to check on the company’s claim about what percentages of each color are produced. (Note: M&M’s company is continuously changing the percentages of each color they produce. Please check online resources as to the current trends for the percentages of brown, yellow, orange, green, blue, and red.)
- Instruct students to carefully open their bags of M&M’s and empty them into the plates.
- Have the student sort the candies by color assigning a different color to each plate.
- Students should not count and record the quantity of each color in a spreadsheet. The data in the spreadsheet can then quickly be converted into a bar graph and pie chart.
Conclusion: Ask questions like:
- Which color has the most quantity, second most, least, etc.?
- Compare your findings to the company’s claims. Are they in agreement?
Lesson Name: Fun with Food Part II: Sweet Statistics (Dots-on-the-Spots)
Lesson Description: This lesson will help students use basic counting techniques to calculate the number of unique arrangements or permutations of a number.
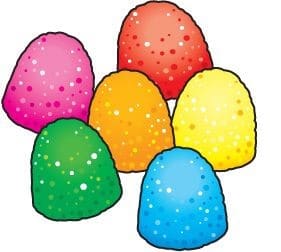
Overview: Using the gumdrops as a physical model, students will start making arrangements of three gumdrops at a time, then four, etc. They will keep track of and record the arrangements they have made. The fundamental counting principle will allow students to calculate the number of arrangements that can be made when a certain number of colors are chose to fill a pre-determined number of slots. For example, if 5 colors are selected to fill 3 slots, the fundamental counting principle would say 5 permutation 3 equals 5x4x3 or 60. If 6 colors were chosen to fill 4 slots, then the expression becomes 6x5x4x3 or 360.
S.T.E.A.M. Integration
Science: The science behind this lesson is in the defining of permutations and the fundamental counting principle.
Technology: The technology can be applied as we look at how permutations can be applied to real-life situations like games of chance.
Engineering: The engineering is in the making and tracking of the different color arrangements.
Art: The art is in the color sorting.
Math: Mathematics enters this lesson with the calculation of the permutations with the aid of the fundamental counting principle.
Extend-Expand-Explore: Have students predict how the number of arrangements will change when more colors are added to the sample space. How do the numbers change if colors can be repeated?
![]()
Lesson Plan
Title: Fun with Food Part II: Sweet Statistics (Dots-on-the-Spots)
Objective: Students will be able to use the fundamental counting principle to calculate the number of different arrangements that could be made with the different color gumdrops selecting different groups at a time.
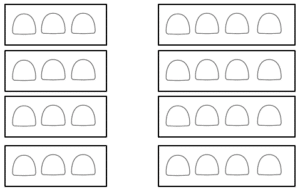
Materials: gumdrop candies, crayons, worksheet (below)
Procedure:
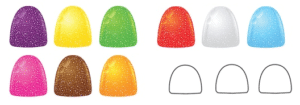
- Distribute the gumdrop dots worksheet.
- Have students open up their bags of gumdrops and sort them by color.
- Using the gumdrops as a physical model, have students start by selecting three gumdrops at a time and arrange them in a row.
- Use the crayons and the worksheet to record the arrangements by coloring in the empty gumdrops on the paper. (Note: when 3 colors are selected, 6 arrangements can be made. This is because there are 3 positions to place the first gumdrop, 2 positions to place the second gumdrop, and 1 position to place the last gumdrop. The fundamental counting principle lets you multiple 3x2x1 to get 6.
- Have students repeat this procedure using four gumdrops and calculate that the number of arrangements would be 4x3x2x1 or 24.
- Then have the students explore what happens when more colors are introduced into the sample space.
Conclusion: Have a group discussion with the participants. Ask them to explain what they have discovered about the number of arrangements that can be made. Have students consider how the number would change if the order of the colors did not matter (combination).
Worksheet:
