


Virtual S.T.E.A.M. Lesson: Animal Cracker Population Tracker
In these times of learning at a distance, many S.T.E.A.M. teachers were caught off guard. Not having uniform kits prepared for all of their students made conducting a virtual S.T.E.A.M. lesson challenging. In this series, we are going to offer lesson ideas for the S.T.E.A.M. teacher that can be completed virtually with students using items that can be found at home or acquired for a minimal cost. This is also an opportunity for children to get their parents involved in the learning process and advertise your S.T.E.A.M. program.
Lesson Name: Animal Cracker Population Tracker
Lesson Description: Wild animals roam free in their natural habitats. They can move and migrate, yet scientists are still able to track them and even count them. Did you ever wonder how they are able to keep track of and count animals that are moving in the wild, especially when they look similar? We are going to find out with this Animal Tracker simulation.
Overview: It is difficult to keep track of a large group, especially when they are not all in the same place at the same time. In this project, we will use the “capture, tag, and release” method for estimating how many animals are in our population. Students can work solo or in pairs, at the teacher’s discretion. Start by having the students empty the contents of their animal cracker box or Goldfish crackers bag. Next, have the students select a pre-determined number of the crackers. These “captured” animals will be “tagged” with the marker. These “tagged” animals will then be released back into the population. Now have a student pick a given amount of crackers from the “population.” At this point, a simple proportion is used to calculate the entire population based on the number that were re-captured with tags.
S.T.E.A.M. Integration
Science: This lesson simulates the scientific process of how researchers track animals in the wild. Animals will be “captured,” “tagged,” and “released” back into the population. Later, another “capture” will be conducted.
Technology: Teachers can compare this simple method of animal tracking with high-tech methods that use GPS tracking as well as the different types of species that are tracked.
Engineering: The engineering is in the design of the experiment. Here, we have a target population in which we randomly selected a sample to be ‘tagged’ and then ‘released’ into the population. The tagged animals were then mixed into the group as they would naturally integrate into the population.
Art: Art can be incorporated into this project as part of an extension piece. Different symbols, or unique designs, or even an array of colors can be used to tag the animals. You can then assign various meanings to these different coding techniques in subsequent experiments.
Math: Mathematics enters this lesson with basic counting and proportions and escalates into statistics with population and sample calculations.
Extend-Expand-Explore: Change the experience by altering the total number in the population. Experiment by comparing the results when more or fewer animal crackers are tagged. In addition, Forego counting the total population at the beginning of the experiment and let it be a mystery until the end.
Lesson Plan
Title: Animal Cracker Trackers
Objective: To have students simulate how a population can be estimated
Materials: Animal Crackers or Goldfish Crackers, markers, paper plates
Procedure:
- Have students empty the contents of their animal cracker box or Goldfish crackers bag and spread them out onto their paper plates.
- Students can now count their entire population of crackers. Keep in mind that this step is something we can do in a simulation. There would be no feasible way to count the entire population of animals moving in the wild. We are doing this step for the sake of comparing our estimate for accuracy later.
- Next, have the students select eight of the crackers. These “captured” animals will get “tagged” with the marker by placing an “X” or a dot on one side.
- These tagged animals are then released back into the population. We do this by turning them over so the ‘tag’ cannot be seen and then gently shuffling them back in with the remaining crackers.
- Now have a student select eight crackers from the population. It might help if they keep their eyes closed to encourage the randomness of the selection.
- Once the selection has been made, the student should flip the crackers over to see how many of the re-captured animals have tags.
- At this point, it is time to do some mathematical calculations. Multiple the 8 total tagged by the 8 total ‘re-captured’. The product is 64. Then divide the 64 by the number of re-captured that have tags. Compare this number to the known quantity of the total population.
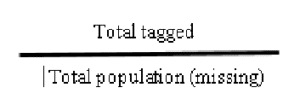
Here is a look at the proportion we are using to calculate the population estimation:
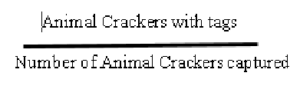
![]()
Conclusion: Repeat the experiment multiple times and record the results. Each time, check the range between the population estimate and the actual number in the population. Consider taking other measures of center like the mean and median of the results. Have students compare their results with others in the class.


